BTCUSD - 4H - Cyatophilum Golden X - RSI [BACKTEST]This indicator is a custom combo of Ema crosses, RSI divergences and Support/resistance , engineered to make the most profit possible.
ABOUT THE STRATEGY
The Net Profit (Gross profit - Gross loss) is calculated with a commission of 0.05% on each order.
Each trade is made with 1 BTC : The backtest buys 1 BTC and sells 1 BTC.
If you decided to Short or Long, profits can be higher, but trade at your own risk.
To use this strategy on a ALT/BTC market (for trading altcoins), change the default Order Size from 1 Contract to 100% of Equity.
There are two kind of buy signals : Green and Blue triangles, that are two great Buy/Long entries.
There are also two kind of sell signals: Red and Orange triangles, that are two great Sell/Short entries.
The indicator comes with automatic Alerts that trigger on Green and Blue triangles for a Buy Alert, or that trigger on Red and Orange triangles for a Sell Alert.
If you are interested in purchasing the indicator and want to try it, then please leave a comment.
An alert setup indicator version is available on my profile.
-----------------------------------------------------------------------------------------
I am also available for PineScript Development and Reverse Engineering.
Join my discord:
discord.gg
Cerca negli script per "rsi divergence"

Cyatophilum Golden X - RSI [INDICATOR] [ALERT SETUP]This indicator is a custom combo of Ema crosses, RSI divergences and Support/resistance, designed to make the most profit possible.
It is a pretty solid indicator for trading BTC in 4H.
There are two kind of buy signals : Green and Blue triangles, that are two great Buy/Long entries.
There are also two kind of sell signals: Red and Orange triangles, that are two great Sell/Short entries.
The indicator comes with automatic Alerts that trigger on Green and Blue triangles for a Buy Alert, or that trigger on Red and Orange triangles for a Sell Alert.
If you are interested in purchasing the indicator and want to try it, then please leave a comment.
A strategy version should follow on my profile soon.
-----------------------------------------------------------------------------------------
I am also available for PineScript Development and Reverse Engineering.
Join my discord:
discord.gg

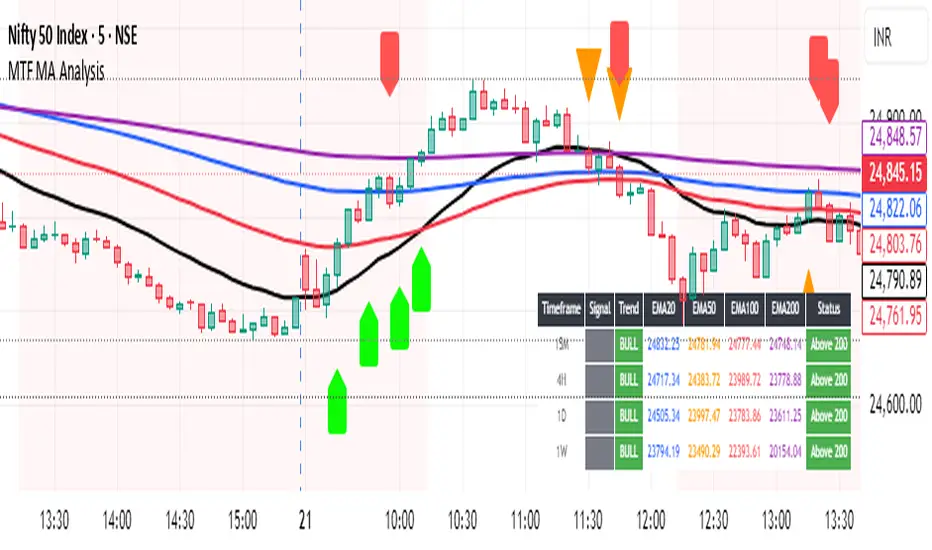
Multi-Timeframe MA Breakout/Breakdown Analysis📊 Overview
This sophisticated Pine Script indicator revolutionizes breakout/breakdown analysis by distinguishing between fake and genuine signals using a unique swing-level validation methodology. Unlike traditional moving average crossovers, this system validates price movements against historical swing points, providing traders with high-probability entry and exit signals across multiple timeframes.
🎯 Core Trading Methodology
The Swing Validation Concept:
Traditional MA breakouts often fail because they don't consider the context of previous price action. This indicator solves this by:
Recording swing levels when each MA is initially crossed
Validating subsequent crosses against these historical swing points
Classifying signals as fake or genuine based on this validation
Tracking signal evolution as price action develops
Signal Classification System:
🔻 Breakdown Analysis:
Fake Breakdown: Price cuts below MA but stays above the swing low from previous MA cut
Genuine Breakdown: Price cuts below MA and falls below the swing low from previous MA cut
Validation Chain: EMA 50 validates against EMA 20 swing low, EMA 100 against EMA 50 swing low, EMA 200 against EMA 100 swing low
🔺 Breakout Analysis:
Fake Breakout: Price crosses above MA but stays below the swing high from previous MA cross
Genuine Breakout: Price crosses above MA and exceeds the swing high from previous MA cross
Validation Chain: EMA 50 validates against EMA 20 swing high, EMA 100 against EMA 50 swing high, EMA 200 against EMA 100 swing high
📈 Signal Interpretation Guide
Visual Chart Signals:
Breakdown Signals:
🔻 Orange Triangle Down + "FAKE BREAKDOWN": Potential reversal opportunity - price likely to bounce
🔻 Red Triangle Down + "GENUINE BREAKDOWN": Trend continuation - expect further downside
🔺 Lime Triangle Up + "BULLISH REVERSAL": Strong buy signal after fake breakdown validation
Breakout Signals:
🔺 Orange Triangle Up + "FAKE BREAKOUT": Potential reversal opportunity - price likely to decline
🔺 Dark Red Triangle Up + "GENUINE BREAKOUT": Trend continuation - expect further upside
🔻 Fuchsia Triangle Down + "BEARISH REVERSAL": Strong sell signal after fake breakout validation
Multi-Timeframe Analysis Table:
Signal Column Interpretation:
"FAKE BD" (Orange): Fake breakdown detected - watch for bullish reversal
"GENUINE BD" (Red): Genuine breakdown - bearish continuation likely
"FAKE BO" (Orange): Fake breakout detected - watch for bearish reversal
"GENUINE BO" (Dark Red): Genuine breakout - bullish continuation likely
"BULLISH" (Lime): Bullish reversal confirmed - strong buy signal
"BEARISH" (Fuchsia): Bearish reversal confirmed - strong sell signal
Trend Column:
"BULL" (Green): EMAs in bullish sequence (20>50>100>200)
"BEAR" (Red): EMAs in bearish sequence (20<50<100<200)
"SIDE" (Gray): Sideways/mixed EMA alignment
Status Column:
"Above 200" (Green): Price above 200 EMA - bullish bias
"Below 200" (Red): Price below 200 EMA - bearish bias
"At 200" (Gray): Price at 200 EMA - neutral
💡 Trading Strategies
Strategy 1: Fake Signal Reversal Trading
For Long Entries (Fake Breakdown Reversal):
Wait for fake breakdown signal (orange triangle down)
Confirm bullish reversal (lime triangle up) when price reclaims EMAs
Enter long on bullish reversal confirmation
Stop loss below the swing low that validated the fake breakdown
Target next resistance level or previous swing high
For Short Entries (Fake Breakout Reversal):
Wait for fake breakout signal (orange triangle up)
Confirm bearish reversal (fuchsia triangle down) when price falls below EMAs
Enter short on bearish reversal confirmation
Stop loss above the swing high that validated the fake breakout
Target next support level or previous swing low
Strategy 2: Genuine Signal Trend Following
For Trend Continuation Longs:
Identify genuine breakout (dark red triangle up)
Confirm higher timeframe alignment (4H/1D showing bullish trend)
Enter on pullback to broken resistance (now support)
Stop loss below the validation swing high
Target measured move or next major resistance
For Trend Continuation Shorts:
Identify genuine breakdown (red triangle down)
Confirm higher timeframe alignment (4H/1D showing bearish trend)
Enter on pullback to broken support (now resistance)
Stop loss above the validation swing low
Target measured move or next major support
Strategy 3: Multi-Timeframe Confluence
High-Probability Setups:
Align signals across timeframes (15M signal + 4H trend confirmation)
Look for confluence (multiple timeframes showing same signal type)
Prioritize higher timeframe signals for swing/position trades
Use lower timeframes for precise entry timing
⚠️ Risk Management Rules
Position Sizing:
Fake signal trades: Reduce position size (higher risk, higher reward)
Genuine signal trades: Standard position size (trend following)
Multi-timeframe confluence: Increase position size (higher probability)
Stop Loss Guidelines:
Fake breakdown longs: Stop below validation swing low
Fake breakout shorts: Stop above validation swing high
Genuine signals: Stop beyond the MA that was broken
Reversals: Stop beyond the reversal invalidation level
Take Profit Strategies:
Scale out at key resistance/support levels
Trail stops using the 20 EMA for trend following
Take partial profits at 1:2 risk/reward ratio
Let winners run on strong trend continuation signals
🔧 Best Practices
Signal Validation:
Wait for candle close before acting on signals
Check volume confirmation on breakouts/breakdowns
Consider market context (news, earnings, etc.)
Avoid trading during low liquidity periods
Timeframe Selection:
Scalping: 15M signals with 4H trend filter
Day Trading: 4H signals with 1D trend filter
Swing Trading: 1D signals with 1W trend filter
Position Trading: 1W signals for major moves
Market Conditions:
Trending Markets: Focus on genuine signals for continuation
Range-Bound Markets: Focus on fake signals for reversals
High Volatility: Reduce position sizes and widen stops
Low Volatility: Look for breakout setups with volume
📋 Advanced Tips
Signal Evolution Monitoring:
Watch for signal transitions (fake becoming genuine or vice versa)
Adjust positions when signal classification changes
Use alerts to stay informed of signal updates
Monitor multiple timeframes for comprehensive analysis
Confluence Factors:
Support/Resistance levels at signal points
Volume spikes on genuine signals
RSI divergences with fake signals
Fibonacci retracements at reversal points
Common Pitfalls to Avoid:
Don't chase signals after significant moves
Don't ignore higher timeframe trends
Don't overtrade on every signal
Don't neglect risk management rules
🎯 Quick Reference
Bullish Signals Priority:
Bullish Reversal (Lime) - Highest priority
Fake Breakdown (Orange) - High probability reversal
Genuine Breakout (Dark Red) - Trend continuation
Bearish Signals Priority:
Bearish Reversal (Fuchsia) - Highest priority
Fake Breakout (Orange) - High probability reversal
Genuine Breakdown (Red) - Trend continuation
Multi-Timeframe Hierarchy:
1W: Major trend direction
1D: Intermediate trend and swing levels
4H: Short-term trend and entry timing
15M: Precise entry and exit points
⚡ Pro Tip: The most powerful signals occur when fake signals reverse into genuine signals in the opposite direction, creating high-momentum moves with excellent risk/reward ratios.
Disclaimer: This indicator is for educational purposes. Always combine with proper risk management, additional technical analysis, and fundamental research before making trading decisions. Past performance does not guarantee future results.
VWAP Predictive Breakout + RSI + OB + Trend/Chop📈 VWAP Predictive Breakout + RSI + Order Blocks + Trend/Chop Filter
This multi-layered day trading and scalping tool is designed to predict price direction after a VWAP breakout, rather than react to it. It combines volume, RSI, candlestick structure, order blocks, and trend/chop analysis to improve the accuracy of intraday signals.
🔍 Core Features
VWAP Predictive Breakout
Signals are generated when price breaks above/below VWAP with strength (volume spike + strong candle body), supported by trend confirmation.
RSI Momentum Filter
Uses RSI divergence behavior to validate breakouts, filtering out weak or exhausted moves.
Order Block Detection
Marks bullish and bearish engulfing patterns and checks for proximity to these zones as confirmation for breakouts.
Trend vs Chop Detection
Uses ADX, ATR, EMA distance, Bollinger Band width, and candlestick cleanliness to dynamically identify whether the market is trending or choppy.
Clean Candle Behavior
Filters out noisy or indecisive candles by analyzing wick-to-body ratio and ATR-based body size.
📌 Visual Markers
🟢 Buy Signal: Green triangle below bar
🔴 Sell Signal: Red triangle above bar
🟢⚪ Bullish Order Block: Green circle
🔴⚪ Bearish Order Block: Red circle
🟩 Trending Background: Light green
🟥 Choppy Background: Light red
🛎 Alerts Included
Long signal: VWAP breakout + RSI + Order Block + Clean Candle
Short signal: VWAP breakdown + RSI + Order Block + Clean Candle
🧠 Best Use Cases
Scalping high-probability VWAP reversals or continuations
Day trading in markets where trend clarity is critical
Filtering noise in sideways conditions using real-time chop detection

ScalpSwing Pro SetupScript Overview
This script is a multi-tool setup designed for both scalping (1m–5m) and swing trading (1H–4H–Daily). It combines the power of trend-following , momentum , and mean-reversion tools:
What’s Included in the Script
1. EMA Indicators (20, 50, 200)
- EMA 20 (blue) : Short-term trend
- EMA 50 (orange) : Medium-term trend
- EMA 200 (red) : Long-term trend
- Use:
- EMA 20 crossing above 50 → bullish trend
- EMA 20 crossing below 50 → bearish trend
- Price above 200 EMA = uptrend bias
2. VWAP (Volume Weighted Average Price)
- Shows the average price weighted by volume
- Best used in intraday (1m to 15m timeframes)
- Use:
- Price bouncing from VWAP = reversion trade
- Price far from VWAP = likely pullback incoming
3. RSI (14) + Key Levels
- Shows momentum and overbought/oversold zones
- Levels:
- 70 = Overbought (potential sell)
- 30 = Oversold (potential buy)
- 50 = Trend confirmation
- Use:
- RSI 30–50 in uptrend = dip buying zone
- RSI 70–50 in downtrend = pullback selling zone
4. MACD Crossovers
- Standard MACD with histogram & cross alerts
- Shows trend momentum shifts
- Green triangle = Bullish MACD crossover
- Red triangle = Bearish MACD crossover
- Use:
- Confirm swing trades with MACD crossover
- Combine with RSI divergence
5. Buy & Sell Signal Logic
BUY SIGNAL triggers when:
- EMA 20 crosses above EMA 50
- RSI is between 50 and 70 (momentum bullish, not overbought)
SELL SIGNAL triggers when:
- EMA 20 crosses below EMA 50
- RSI is between 30 and 50 (bearish momentum, not oversold)
These signals appear as:
- BUY : Green label below the candle
- SELL : Red label above the candle
How to Trade with It
For Scalping (1m–5m) :
- Focus on EMA crosses near VWAP
- Confirm with RSI between 50–70 (buy) or 50–30 (sell)
- Use MACD triangle as added confluence
For Swing (1H–4H–Daily) :
- Look for EMA 20–50 cross + price above EMA 200
- Confirm trend with MACD and RSI
- Trade breakout or pullback depending on structure

Stochastic RSI OHLC StrategyThe script titled "Stochastic RSI High Low Close Bars" is a versatile trading strategy implemented in Pine Script, designed for TradingView. Here's an overview of its features:
Description
This strategy leverages the Stochastic RSI to determine entry and exit signals in the market, focusing on high, low, and close values of the indicator. It incorporates various trading styles, stop-loss mechanisms, and multi-timeframe analysis to adapt to different market conditions.
Key Features
Stochastic RSI Analysis:
Uses the Stochastic RSI to identify potential entry points for long and short positions.
Tracks high, low, and close values for more granular analysis.
Multiple Trading Styles:
Supports diverse trading styles like Volume Color Swing, RSI Divergence, RSI Pullback, and more.
Allows switching between these styles to suit market dynamics.
Session-Based Trading:
Offers session control, limiting trades to specific hours (e.g., NY sessions).
Can close all positions at the end of the trading day.
Stop-Loss and Take-Profit Mechanisms:
Includes both static and dynamic stop-losses, with options for time-based stops, trailing stops, and momentum-based exits.
Customizable take-profit levels ensure efficient trade management.
Volume Analysis:
Integrates volume indicators to add a bias for trade entries and exits, enhancing signal reliability.
Multi-Timeframe Integration:
Employs multi-timeframe RSI analysis, allowing the strategy to capture broader trends and optimize entries.
This script is designed to provide flexibility and adaptability, making it useful for different trading strategies and market conditions. It is suitable for traders looking to refine their entries and exits with a focus on the Stochastic RSI.

RSI Multi Strategies With Overlay SignalsHello everyone,
In this indicator, you will find 6 different entry and exit signals based on the RSI :
Entry into overbought and oversold zones
Exit from overbought and oversold zones
Crossing the 50 level
RSI cross RSI MA below or above the 50 level
RSI cross RSI MA in the overbought or oversold zones
RSI Divergence
With the signals identified, you can create your own strategy . (If you have any suggestions, please mention them in the comments).
Beyond these signals, you can set SL (Stop Loss) and TP (Take Profit) levels to better manage your positions.
SL Methods:
Percentage: The stop loss is determined by the percentage you specify.
ATR : The stop level is determined based on the Average True Range (ATR).
TP Methods:
Percentage: The take profit is determined by the percentage you specify.
RR ( Risk Reward ): The take profit level is determined based on the distance from the stop level.
You can mix and match these options as you like.
What makes the indicator unique and effective is its ability to display the RSI in the bottom chart and the signals, SL (Stop Loss), and TP (Take Profit) levels in the overlay chart simultaneously. This feature allows you to manage your trading quickly and easily without the need for using two separate indicators.
Let's try out a few strategies together.
My entry signal: RSI Entered OS (Oversold) Zone
My exit signal: RSI Entered OB (Overbought) Zone
I'm not using a stoploss for this strategy ("Fortune favors the brave").
Let's keep ourselves safe by adding a stop loss.
I'm adding an ATR-based stop loss.
I think it's better now.
If you have any questions or suggestions about the indicator, you can contact me.
Cheers

BUY/SELL RSI FLIUX v1.0The "BUY/SELL RSI FLUX v1.0" indicator is designed to provide buy and sell signals based on the RSI (Relative Strength Index) and price action in relation to support and resistance levels. It overlays directly on the price chart and includes the following components:
- Support and Resistance Levels: Determined over a specified number of bars (lengthSR), these levels represent potential barriers where price action may stall or reverse.
- ATR (Average True Range): Used to measure market volatility. While it's calculated in the script, it's not visualized on the chart as per the latest modification.
- RSI: The RSI is calculated over a defined period (lengthRSI) and is used to identify overbought or oversold conditions. Buy signals are generated when the RSI is below the oversold threshold (rsiOversold) and the price is above the support level. Conversely, sell signals occur when the RSI is above the overbought threshold (rsiOverbought), the price is below the resistance level, and additionally, the price is below a long-term moving average, which acts as a trend filter.
- Long-Term Moving Average: This moving average is plotted to help identify the prevailing market trend. Sell signals are filtered based on the price's position in relation to this moving average.
- Buy/Sell Signals: Visual representations in the form of shapes are plotted below (for buy) or above (for sell) the price bars to indicate potential entry points.
By combining these elements, the indicator aims to provide high-probability trading signals that align with both the market's momentum and trend.

TDMACD Divergence Multi Timeframe and Alert [5ema]I reused some functions, made by (i believe that):
@paaax: The table position function.
@everget: The RSI divergence function.
@QuantNomad: The function calculated value and array to show on table for input symbols.
@ChaosTrader: The function calculated value TDMACD.
-----
What to do?
MACD divergence signal.
The crossing of MACD and Signal line.
The reversal of MACD.
The reversal of Signal line.
The screener follow 6 different timeframes.
Set notification alert when signal appears.
-----
How is it created?
MACD line = fastMA - slowMA.
Signal line = ta.ema(macd(), signalLength)
Make function for pivot low & high point of MACD and price.
Request.security that function for earch time frame.
-----
How to use?
Can be combined with many other indicators or candlestick patterns.
Customize the input indicators to suit your strategy
1. MACD reversed:
2. Signal line reversed:
3. MACD Divergence :
4. MACD crossing Signal line:
5. Signal on Screener for multi time frame:
Green ⦿: Buy.
Red ⦿: Sell.
Green 〇: Review Buy.
Red 〇: Review Sell.
-----
This indicator is for reference only, you need your own method and strategy.
If you have any questions, please let me know in the comments.

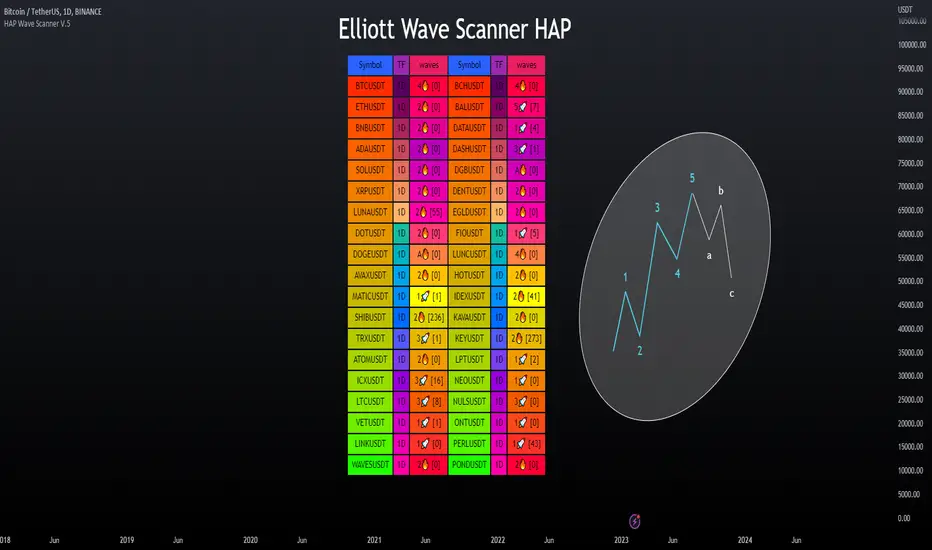
Elliott Wave Scanner - HAP [PRO] ▶Elliott Wave Scanner
This is an added feature of the wave drawing version, but this version is used for scanning multiple currency pairs simultaneously, based on the custom list you have specified as your preferred ones, making it more convenient for you.
This :
════════════════════════
This will be an adjustment of the number bars to be similar to the version in the drawing wave, with the only difference being that this version will be a scan of multiple waveforms simultaneously, including the input data format. It is recommended to only change the numbers, maintaining the original structure to avoid any errors, as demonstrated in the example below.
This is a valid example.👇
Wave0= (21),
Wave1= (13),
Wave2= (8),
Wave3= (21),
Wave4= (13),
Wave5= (34),
WaveA= (13),
WaveB= (8),
WaveC= (21)
**Kindly note to specify the numerical sequence of each wave. Parentheses should always be preceded by a comma and conclude on the final line without one.
════════════════════════
▶Let's take a look at the different parts of the scanned version.
════════════════════════
🎯 Bringing in the RSI to help make decisions, as referenced in the book by "Jason Perl".
if the market is advancing as part of a bullish HAP WAVE up sequence, then the RSI should remain above `40` during corrective setbacks for HAP WAVEs 2 and 4. Similarly, if the market is declining as part of a bearish HAP WAVE down sequence, then the RSI should remain beneath 60 during corrective for HAP WAVEs 2 and 4
For example, an uptrend in Wave tends to cause an RSI divergence between Wave 5 and Wave 3. When Wave 5 exceeds Wave 3, the RSI is often seen at Wave 5, which is lower than Wave 3.
TIGER ALERT RSI DIVThats our first RSI DIV indicator for free use.
What is an RSI divergence?
What Is the Relative Strength Index (RSI)?
The relative strength index (RSI) is a momentum indicator used in technical analysis.
RSI measures the speed and magnitude of a security's recent price changes to evaluate overvalued or undervalued conditions in the price of that security.
The RSI can do more than point to overbought and oversold securities. It can also indicate securities that may be primed for a trend reversal or corrective pullback in price. It can signal when to buy and sell. T
raditionally, an RSI reading of 70 or above indicates an overbought situation. A reading of 30 or below indicates an oversold condition.

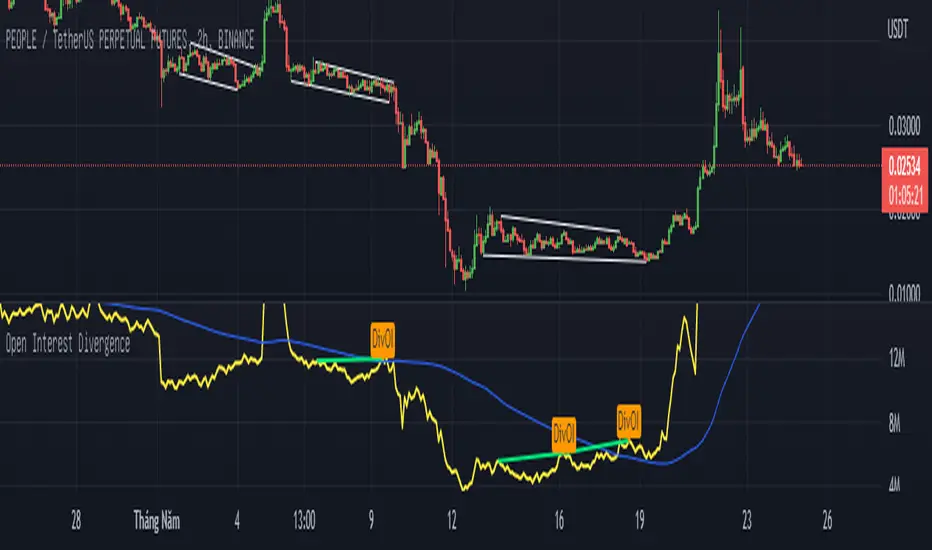
Open Interest Divergence (OI vs Price)This indicator show having increasing Open Interest but price still move in a range (Open Interest Divergence vs price).
It is same with Divergence of indicators as RSI Divergence, Macd Divergence, .... It is easy to understand.
Additional, with MA line OI, you can see the change of OI.
Favorite Signals w/EMA FilterThe script combines my favorite signals then filters them with three EMAs.
Via the Style tab, you can choose to either have the signals color the bar and/or plot a shape above/below.
All signals can be turned off via the Inputs tab, which will remove the bar color and/or shape (if not already off in the Style tab) as well as remove the pattern from the alerts function.
Remember when using TV alerts, if you change the script settngs, you must create a new alert if you wish to be alerted for the changes you've made.
LONG/SHORT SIGNALS INCLUDED FOR:
- TD8s
- TD9s
- Hammer
- Shooting Star
- Bullish Harami
- Bearish Harami
- RSI Divergences
EMA FILTER LOGIC LONGS:
- Price < Fast EMA & Med EMA > Slow EMA = Possible Long Entry
- Price > Fast EMA & Med EMA > Slow EMA = Possible Reversal, Tighten Stop or Reduce Position
EMA FILTER LOGIC SHORTS:
- Price > Fast EMA & Med EMA < Slow EMA = Possible Short Entry
- Price < Fast EMA & Med EMA < Slow EMA = Possible Reversal, Tighten Stop/Reduce Position
Big up to @spdoinkal, @HPotter, @LonesomeTheBlue, for writing the originals scripts for the signals above.
Enjoy!
Adaptive RSI (CryptoLawyer11)When the price is overbought RSI background will light in red!
the higher it goes up the darker the color will get!
same thing goes for over sold!
when the price goes over sold it will light in green
and lower it gets, it'll get darker !
RSI line it self changes color based on its value, above 65 is light red above 80 is dark red
and when over sold it will become more and more green starting from 50 which is light greem, all the way down to 20 which is lime green!
it has a red line that acts as EMA, once the rsi is below it candle color will become black indicating that its not yet good to buy!
once down trend is over it will return to normal candle color indicating that you can buy !
disclamir: rsi is not something enough to base you entry and exit on, its just an indication of the most probable price direction, look on YouTube for RSI divergence, once you learn it it is easier to spot using my indicator, because the previous HH will be stronger red compared to the current one, HAPPY TRADING !

[YummyProfit] RSI DivergenceHi everyone,
This scripts are used for learning and research purposes. THESE ARE NOT BUY/SELL SIGNALS.
If you have a better idea, share it here or contact me via msg. I will improve this script better in next version.
Settings:
Basically, you only need to care about "Lookback Level For Divs", this is the number of previously adjacent peak.
Feel free to use, share, comment & feedback.
Get indicator trading signals at yummyprofit.
Good luck!

Rain On Me IndicatorFinally, we made it :D
Rain On Me Indicator, As the name suggests this indicator will make money rain on you. More seriously, this indicator contains :
This indicator contains:
-Bullish and bearish RSI divergences showing on chart with alerts.
-Parabolic SAR with Labels on chart with buying or selling alerts.
-3 Moving Average (MA 1 : 7, MA 2 : 21 MA 3 HIDDEN : 50 (Cross alerts for Pullback)
-Customizable Bollinger band
-Fibonacci on 10 levels with the level 0 to the middle. This Fibonacci help a lot since it can let you find easily entry/exit point, trend and even where to place your Take Profit and Stop Loss. It have alerts for most important levels (0.382, 0.§, 0.618) for Crossunder and Crossover in Bullish or Bearish trend.
-Fully Customizable Ichimoku Cloud.
-Trend Buy/Sell Labels on chart with buying or selling signal alerts.
-Trend color visible on candles.
If an alert trigger of Buy/Sell Signal with the same alert based on PSAR, so you can be confident to enter in position. Alway checking fibs level that is the key thing with this indicator. the script has been set to have the best possible results on as many market as possible. But.best result for zfter backtesting is on
Forex : EUR/USD, USDJPY, USDCAD.
Indice : S&P500, NASDAQ, DOWJONES
Commodities : OIL, WTI
Everything work on following timeframe :
15MN, 1H, 4H, DAILY, WEEKLY.
So that you can avoid having to set it again, whether it be in minutes, hours, days, months.
So you can easily trade in the mode that suits you best. It works well on everything from indices to forex to commodities etc. I thank all those who allowed me to carry out this project. IF you feelt free to give your ideas, suggestions, for improve it by sending me messages.
This is really a first version sp it may contain bugs / errors that will be fixed over time.
A BIG THANK YOU TO QUANTNOMAD WHO GIVE ME HIS PERMISSION TO USE, MODIFY AND REPUBLISH HIS "Ultimate Pivot Points Alerts" Script Indicator :
Good trade to all !

MACD and RSI divergence by SANDWICHIdentifies hidden price areas of RSI and MACD divergence in the market. Use for major currency pairs, I find it works best on SPY or SPX500 though.

Cyatophilum BITCOIN Daily IndicatorFree indicator
To get it, add it to your favorites using the button below, then you will find it on your chart in the "favorites scripts" tab
I wanted to have a tool that would quickly show me an overview of the Bitcoin chart each day, and receive alerts when something was happening, so I made this indicator.
Optimized for Bitcoin / USD on the daily timeframe, this indicator uses many technical tools such as a double Donchian channel, momentum, volume, RSI, divergences and moving averages.
HOW TO USE
Signals - You can create Automated Alerts corresponding to the graphic labels on chart.
BUY: Most bullish signal. Go long or buy bitcoin if you haven't already.
⚠️ REVERSAL: The bear trend might be over soon. Prepare some stable coins on your exchange to make sure you are ready to trade.
⚠️ RISE: Very bullish signal meaning a lot of people are buying. At this point you should just follow the sheep herd and buy.
⚠️ DROP: A drop is very likely to happen. Take your profits even though the rally can continue. Most of the time the price will drop significantly.
SELL: Most bearish signal. Go short or sell bitcoin.
Note: Use 'Once per bar close' option when creating alerts to get the exact same signals as on the chart, but only at candle close. Otherwise use 'Oncer per bar' to get them as soon as possible but the graphic-signal can disappear (unvalidated) at candle close.
Parameters
"Show 3 EMAs": Show a 50, 100 and 200 EMA. Usefull for golden/death cross.
"Channel_Length" Length in bars for the double Donchian Channel. Default is 30.
Any feedback is welcome!
To get access to my private strategies, use the link below

Backtest PREMIUM Suite+ (Plug & Play)Hello traders
I. 💎 SCRIPTS ACCESS AND TRIALS 💎
1. For the trial request access, they have to be done through my website .
2. My website URL is in this script signature at the very bottom (you'll have to scroll down a bit and going past the long description) and in my profile status available here : Daveatt
Due to the new scripts publishing house rules, I won't mention the URL here directly. As I value my partnership with TradingView very much, I prefer showing you the way for finding them :)
3. Many video tutorials explaining clearly how all our indicators work are available on our website > guides section.
4. You may also contact me directly for more information
II. 🔎 Backtest PREMIUM Suite+ (Plug & Play) 🔎
2.1 Forewords
This indicator is available only to our PREMIUM 12 months users. YES! I said indicator, and not strategy or backtest for an excellent reason.
We wanted to make it as generic as possible and allow anyone to connect any indicator of his/her choice in a few clicks only.
This is NOT possible (in TradingView) with a strategy/backtest, but only with an indicator - that's why we worked on recoding the whole backtest logic as an indicator.
The PRO edition does not handle any pyramiding/re-entry - as such enters only once per trend by design. This feature is reserved for our PREMIUM users.
2.2 Concept
This is an indicator that I saw on TradingView and was introduced by the @Pinecoders account on TradingView.
I inspired myself from his Backtest Engine to offer a version more adapted to my vision - The benefits of connecting yourself any indicator to our Backtest engine are amazing and huge.
The concept can't be more simple. Imagine using any indicator and connecting to a backtest system in a single click.
You may connect your Algorithm Builder also to this complete backtesting system in a single click.
What's better between paying thousands for each backtest, or connecting yourself your indicators to your backtest with a click?
That was a rhetoric question, but you can still share your answer with me if you want to :)
III. The amazing benefits of our🔌&🕹️ (Plug&Play) system
Issue #1 💲 A BACKTEST SYSTEM IS COSTLY 💲
Hiring a developer to code a custom indicator is costly. For a custom backtest it's even more expensive as those scripts are very often way more complicated.
Now imagine, that now that you see your idea live on a chart, you'll realize you'll have to finance another backtest system, as the one you have is not compatible with your new idea.
Solution #1 💲💲 YOU COULD BE SAVING SOME MONEY 💲💲
just because it won't be needed to hire someone else for each of your trading idea.
We will never guarantee your success on the market, but THIS I stand by it any day any hour.
You can connect any indicator or your choice by updating your indicator slightly and connecting it to our Backtest engine. We send the tutorial for doing it to all our customers.
Issue #2 🕔 IT'S TIME-CONSUMING 🕔
Even if someone is doing all the coding for you, it might require days/weeks depending on your overall trading strategy/idea.
Without even counting the time for you to test/validate the work done and all the back-and-forth to fix all the issues.
Solution #2 SAVING TIME MIGHT EQUATES TO SAVING MONEY : 🕔 = 💲💲💲
I wish it could be as easy as going from weeks of coding to "1 single click" :)
I did the heavy-lifting, but you'll have to make the last effort the cross the finishing line. I made it easy for you to play with it and find a configuration that makes sense to YOU and for your strategy/asset/timeframe
Issue #3 ❌ IT'S COMPLICATED ❌
Someone did a backtest code for you, but... you can't update it because you either :
- don't know anything in programming
- ... and don't have time to learn (most of us have a job/family/...life)
- The system you have is way too specific for one of your previous idea, but can't be updated easily for your next trading ideas. I see a lot of traders nodding right now thinking "that's soooooo true !!!!"
Solution #3 🎉 WE MADE IT EASY AND FUN 🎉
Our goal is to externalize the technical stuff that you don't want to take care of - so that you can finally focus on your trading and optimizing your ideas. #bold #statement
In case you're wondering, no we're not reading your mind :), but we're also traders who didn't know how to code before and had to hire external programmers to do the heavy work for us.
You can be sure that most of the frustrations (trading, technical, ...) you have/had, we had them also and that's why we created this backtest indicator.
III. 🔌&🕹️
Hope you're ready to be impressed. Because, what I'm about to introduce, is my best-seller feature - and available across many of my indicators.
In TradingView, there is a feature called "Indicator on Indicator" meaning you can use an external indicator as a data source for another indicator.
I'm using that feature to connect any external indicator to our Backtest PREMIUM Suite+ (Plug & Play) - hence the plug and play name. Please don't make it a plug and pray :) it's supposed to help you out, not to stress you even more
Let's assume you want to connect your Algorithm Builder Multiple Trends+ to your Backtest PREMIUM Suite+
I mentioned an Algorithm Builder but you may connect any oscillator (MACD, On balance volume, stochastic RSI, True Strenght index, and many more..) or non-oscillator (divergence, trendline break, higher highs/lower lows, candlesticks pattern, price action, harmonic patterns, ...) indicators.
THE SKY IS (or more likely your imagination) is the limit :)
Fear no more. The Plug&Play technology allows you to connect it and use it the backtest calculations.
This is not magic, neither is sorcery, but certainly is way beyond the most awesome thing I've ever developed on TradingView (even across all brokers I know). #bolder #statement
TradingView is the best trading platform by far and I'm very grateful to offer my indicators on their website.
To connect your external indicator to ours, we're using a native TradingView feature, which is not available for all users.
It depends on your TradingView subscription plan ( More info here )
If you intend to use our Algorithm Plug&Play indicator, and/or our Backtest Plug&Play suites, then you must upgrade your TradingView account to enjoy those features.
We value our relationship with our customers seriously, and that's why we're warning you that a compatible TradingView account type is required - at least PRO+ or PREMIUM to add more than 1 Plug&Play indicator per account.
We go in-depth on our website why the Plug&Play is an untapped opportunity for many traders out there - URL available on my profile status and signature
IV. 📊 Make it nice! 📊
Now we're getting right into the fun stuff.
Let's explore briefly each display option (symbolized by an 👁️🗨️ in the Backtest UI) :
- Color Traded Background : Color the chart background is green when in a BUY trade, in red when in a SELL trade. If the Backtest is not in a trade, then the background won't be colored.
- Show Entry/Exit Markers : Displays the entries (Enter Long/Enter Short), and exits (Exit Long/Exit Short) labels.
- Show Entry Level : Displays a blue level line to easily identify the entry price of a trade.
- Show Take Profit Level : Display a purple line to visualize where the Take Profit level is (we'll explain below how to set it up).
- Show In-Trade Stops : Display the stop-loss
V. Backtesting filters
A backtest should have some filters helping the traders testing a few hypotheses. Well.... we included a ton of them.
Once again, thank you @Pinecoders for the help and support you gave me
5.1 ↑ Trade Direction ↓
- Both: The backtest takes the BUY, and SELL trades.
- Longs only/Short only: To be used if the trader wants to take the trades in a unique direction only
5.2 ▲🔷Pyramiding🔷▼
The Backtest PRO allows 1 entry per identified trend
Pyramiding has many names such as Re-entry, secondary trend, Additional entry, ...
Basically, it refers to entering multiple times in the same trend.
Maximum Number of Pyramiding Entries: Literally the max number of re-entries in the same trend.
For instance, if set to 2, then depending on the signals, you'll get at most 2 re-entries in the same trade direction.
- Position Size Multiple of Original Entry Position: Option to add X multiples of the original position size for the re-entries.
Example: Position size multiple = 2, and First entry size is $100. Then, the re-entries position sizes will be ($100 X 2 = $200).
5.3 ▄ █ Position sizing █ ▄
- 1. % of Equity: If selected, the position size used is the input to the right of 1. % of Equity.
Example: The trader starts with a capital of 100K. After a winning trade, your total capital is $103K - for the next trade the position size will be 3% of $103K
- 2. % of Capital: If selected, the position size used is the input to the right of 2. % of Capital.
In other words, the position size will always be the same position size as calculated on the initial capital.
Example: The trader starts with a capital of 100K. After a winning trade, your total capital is $103K - for the next trade the position size will be 5% of $100K. (As 100K is the initial capital used in our dummy example)
5.4⛔ Entry Stops and In-Trade Stops ⛔
We didn't reinvent the wheel here. Any good backtest should offer an entry stop-loss and an in-trade stop-loss.
Giving only here also an example among all the use cases. For instance, the trader sets a stop-loss 2% at the time of entry on your trade, but once the trade moves in the desired direction, the trader might want a trailing stop-loss using a 4% input.
Example: A trader goes LONG on only 1 "ABC" stock evaluated $10 per share.
1) The entry-stop loss will be 2% away so set at $8
2) A candle
3) The trailing stop will activate, and move the stop-loss from the entry stop-loss level (=$8) to $8.32 (=4% move up from $8) - and so on, and so forth for each time the price moves 4% up
The entry and in-trade stop losses can absolutely be identicals. There is no universal rule, and as always you know the drill - all depends on your backtest, and trading strategy as a whole.
5.5 ❌ Hard Exits ❌
⚠️The Backtest PRO Suite offers the hard exit on MACD only.
Our Backtest PREMIUM Suite offers 2 more indicators to invalidate your trades on :
1. MACD
2. Trend Direction
3. RSI divergence (Regular, and Hidden)
The hard exit (or invalidation) is a fundamental part of my trading method.
I explained numerous times on TradingView, our website, and social media channels why I "love" this concept so much, and how it saved my trading account numerous times from getting savagely wrecked by the market.
5.6 💲💲 Take Profit 💲💲
We only included 1 level of Take Profit so far. We'll work on adding at least one more soon.
You can set your Take Profit level based on either a:
1- Fixed value
2 - Percentage value
5.7 📆 Date Range Filtering 📆
If enabled, the backtest only uses the data between the starting and the ending dates of the defined range.
5.8 ⏱️ Hourly Range Filtering ⏱️
Please note that the hours filtering is based on the broker time - not on your chart time.
In other words, if your chart is UTC+1, but you're trading an asset from a US EAST COAST broker, then the timezone used is the UTC-4 timezone.
You'll must be wary of this when filtering and probably do a quick (but simple) calculation before setting up this option.
The easiest would be to set your chart timezone on the broker local timezone (and no math is needed).
Let's add a quick note that the hourly filter is also included in our Algorithm Builders PRO/PREMIUM 12 months. #shameless #self #advertising
5.9 ❗❗ Fees and Slippage ❗❗
Too often completely ignored by many traders, the fees can eat gains out quickly/deepen one's capital faster than expected.
⚠️The fees vary between brokers, and asset traded - it could be recommended to check on your broker page what are the fees for the asset on your chart, and insert that percentage number.
Another cost ignored, even more, is the Slippage.
i.e. think about a Stop-Loss being hit, and we're so confused because we see on the chart that NEVER the price came even close to your SL level, but... it got hit anyway.
Yes! we know how frustrating it is, but that's the game we're playing, and trading should never be about blaming the game, but only blaming the players/traders/ourselves.
Blaming the game constantly is likely to not end with good performance results, but accounting for this "risk", and being able to quantify it is an incredible hedge. #bold #statement #level #10000
5.10 🔔 Alerts 🔔
By design, the alerts aren't available for strategy scripts. But this script is an... indicator so why should we not enjoy all the cards in our hands the fullest.
We enabled the alerts on the:
1. Main BUY/SELL Entry
2. Pyramiding BUY/SELL Entries
3. Exit Signals such as stop-loss, take-profit, hard-exits
You're welcome :)
VI. 📝 Where are the backtest results? 📝
Answer: in the Data Window section of your TradingView
Now the cherry on the cake if we might say so. A backtest is cool, but visualizing results is actually the end goal here.
Our PREMIUM users benefit from way more analytics than the PRO users.
More info available on our website.
The Data Window is dynamic - it means whenever you'll mouseover at a give time on your chart, the data on that panel automatically updates.
Let's assume you're backtesting your idea between Sept 1st, 2019, and Oct 1st, 2019.
If your mouse cursor is located (or hovered) at a candle on Sept 14th, 2019 (data chosen randomly for this example), then the data displayed only includes the results between Sept 1st, and Sept 14th.
More info available on our website with a nice tutorial video. Data window metrics and filters explained on our website
Here's what the data window looks like: imgur.com
If you have any doubt or question, please hit me up directly or ask in the comments section of this script.
I'll never claim I have the best trading methodology or the best indicators.
You only will judge and I'll appreciate all the questions and feedback you're sending my way.
They help me a ton to develop indicators based on all the requests I received.
Kind regards,
Dave
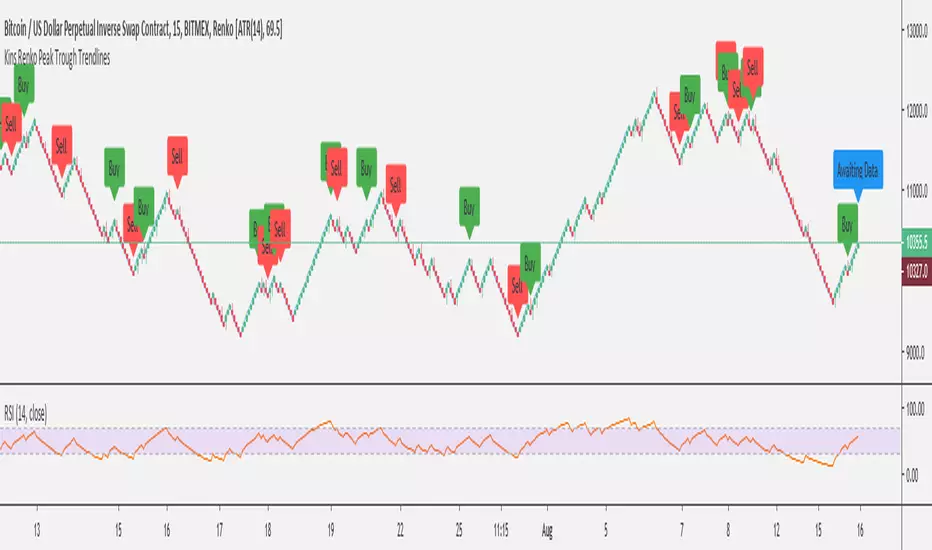
Kins Renko Peak Trough TrendlinesScript is built on the Renko Chart for Bitmex XBT. Looks for swing high/low and RSI divergences as well as some other bits.
This is my first week with Pine Script so there's probably some terrible coding practices in here but the functionality seems acceptable.
Kitaec MultiMagicIts a highly upgraded version of AltsOpportunities script.
Added multiple smart MA's with other indicators attached. For example long MA (boldest) shows RSI divergences on higher timeframes, another one connected to the ADX and DI and so on. Now you can make advanced DYOR on any asset in a few seconds on any timeframe. Enjoy.


RSImemergence 0.1.0v
Simple RSI divergence and momentum shift indicator
Tryng to fuse most efficient RSI divergence script ideas while eliminating the noise and human bias :)
